USDA Hog Prices
Mandatory price reporting for U.S. market hogs (LMR)
USDA hog prices are the prices U.S. packers actually paid producers for market hogs, compiled and published by the U.S. Department of Agriculture (USDA) every business day. They are not auction prices: packers are required by law to report their direct purchases, and the reporting plants account for about 97% of U.S. hog slaughter. The CME Lean Hog Index, used to settle CME Lean Hog futures, is calculated from these data.
The USDA publishes many hog price series, and the industry does not follow them all equally. Each series is defined by five dimensions, shown below on an excerpt of the prior-day slaughter report.
| 3Columns: purchase type → | Negotiated | Other MarketFormula (FUT/OPT) | Swine or PorkMarket Formula | Other PurchaseArrgment | NegotiatedFormula |
|---|---|---|---|---|---|
| 2Producer Sold: | |||||
| Head Count | 2,668 | 22,293 | 124,085 | 84,290 | 640 |
| Carcass4 Base Price5 | 75.68 | 74.04 | 74.62 | 79.00 | * |
| Average Net Price | 74.95 | 76.25 | 75.82 | 80.77 | * |
- 1Purchase or slaughter date
- This report counts hogs by slaughter date. Prices by purchase date are in other reports (LM_HG218, HG216/217)
- 2Who sold the hogs
- The table shows the Producer Sold section. The Packer Sold and Packer Owned sections follow (no prices for Packer Owned)
- 3How the price was set
- The columns are the five purchase types
- 4Weight basis
- Carcass = priced on carcass weight (live-weight purchases are very few)
- 5Quality adjustments
- Base = before adjustments; Net = after premiums and discounts
Which price to watch
CME Lean Hog futures are the most widely followed hog price benchmark. In the cash market, the main reference is the net price in the . To follow the market during the day, use the negotiated prices in the .
Select a box in the diagram to see its description below
Final data on hogs slaughtered the previous day, in separate sections for Producer Sold, Packer Sold and Packer Owned. Includes carcass measurements and, where reported, base and net prices. Its net prices are the main reference for the cash hog market.→ Who sold the hogs
Where the data comes from
Packers must report by law
Reporting is mandatory for federally inspected plants that slaughtered an average of at least 100,000 hogs a year over the previous five years. These plants account for about 97% of hogs slaughtered in the United States (USDA budget documents published in 2025).
In the 1990s, consolidation and vertical integration among U.S. packers reduced the number of hogs whose prices were negotiated on the open market. Formula contracts spread, and the voluntary reporting system of the time captured only about 75% of hog sales.
The immediate trigger was the price collapse of late 1998. Oversupply drove negotiated hog prices to historic lows, while some producers' formula contract prices did not fall as far. Producers complained that they could not see the real market, and Congress passed the Livestock Mandatory Reporting Act of 1999, which took effect in 2001.
Published the next day
Select a box in the diagram to see its description below
- 8 a.m.Prior-day purchases (final)LM_HG218Reported by 7 a.m.
- 10 a.m.Prior-day slaughterLM_HG201Reported by 9 a.m. Net prices appear here
- 11 a.m.Same-day purchases through the morningLM_HG216Reported by 10 a.m.
- 3 p.m.Same-day purchases through the afternoonLM_HG217; distribution of prior-day net pricesLM_HG215Reported by 2 p.m.
- MondaysWeekly summaryLM_HG214
For example, a trade made on Thursday is reported on Friday morning and published the same day. Anyone, not only the parties to the trade, can see what U.S. hogs sold for by the next day. This transparency is the purpose of the program.
Prices are published nationally (National) and for three regions: Iowa/Minnesota, the Western Corn Belt and the Eastern Corn Belt. The national figures include hogs shipped in from Canada.
Sows and boars are covered by a separate report (LM_HG234). All of these reports are free on the USDA website.
Purchase or slaughter date
The reports fall into two groups: purchase data, covering hogs bought that day, and slaughter data, covering hogs actually slaughtered that day.
Live basis and carcass basis
Both are prices for live hogs. The difference is which weight the price is applied to. Under a live-basis contract, the payment is the contract price times the live weight measured at delivery. Under a carcass-basis contract, it is the base price times the carcass weight measured after slaughter.
So a carcass-basis price is not a price for carcasses as they move through the meat trade. It is the price a packer pays a producer for a live hog (see Common misconceptions).
Price: $70/cwt of live weight

Live weight 285 lb (2.85 cwt)
70 × 2.85 ≈ $200 per head
Amount fixed before slaughter
Base price: $93/cwt of carcass weight
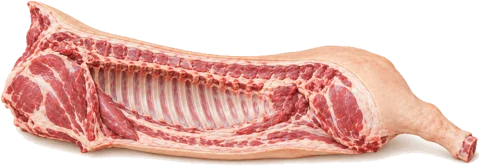
Carcass weight 215 lb (2.15 cwt; yield about 75%)
93 × 2.15 ≈ $200 per head
Most contracts then add quality premiums and subtract discounts
Live-weight pricing does not account for differences in carcass yield, mud on the hog, or lean and fat content. This disadvantages packers.
Measuring the carcass lets the payment reflect differences in yield, lean and fat.
For the same hog, the payment per head is about the same either way. But carcass weight is about 75% of live weight, so carcass-basis prices are roughly 30% higher than live-basis prices. Each purchase uses one basis or the other.
Nearly all hogs are priced on carcass weight
Carcass-basis pricing covered only 8% of U.S. hogs in 1980 but reached 75% by 1999. Today it covers 99.8%: of about 1.84 million hogs slaughtered in a week, only a little over 4,000 are priced on a live basis.
U.S. market reports usually call the physical market “cash hogs,” as opposed to futures, and quote cash hog prices on a carcass basis.
Base price and net price
In practice, the final price is the base price plus premiums and minus discounts for quality (see Further detail).
- Base price — the price before premiums and discounts. It shows the level of the market itself.
- Net price — the price the packer actually paid the producer per 100 lb of carcass weight, after adding all premiums and subtracting all discounts.
Net prices are set only after the carcass is measured, so they appear only in the prior-day slaughter report (LM_HG201).
Who sold the hogs
- Producer Sold — hogs sold to packers by independent producers. Prices are published by purchase type.
- Packer Sold — hogs owned by one packer and sold to another packer for slaughter. Published only as a total across all purchase types.
- Packer Owned — hogs owned by the packer or a subsidiary for at least 14 days before slaughter. These are the internal supply of vertically integrated packers. Because they are not bought or sold, no price is reported; only head counts and carcass data are published.
Packer-owned hogs account for about 40% of U.S. slaughter (40.5% for 2026 to date, from USDA's weekly year-to-date totals). Because these hogs have no sale price, the published “U.S. hog price” is based only on the remaining 60% that are actually bought and sold.
How the price was set
| Purchase type | How the price is set |
|---|---|
| Negotiated | Spot price negotiated lot by lot between buyer and seller, for delivery within 14 days |
| Negotiated Formula | A formula price, with the formula itself negotiated for each lot |
| Swine or Pork Market Formula | A formula tied to cash-market indicators for hogs or pork, such as hog prices or the cutout |
| Other Market Formula | A formula tied to futures or options, or to markets other than hogs and pork (such as grain) |
| Other Purchase Arrangement | Any other arrangement, such as long-term fixed prices or prices tied to feed costs |
To see how each type is priced, look at the purchase-type breakdown in HG201.
Most hogs are priced by formula
The most common combination is Producer Sold × Swine or Pork Market Formula × carcass basis, at 27.7% of all hogs slaughtered.
More than half of the hogs sold by independent producers are priced this way, using a formula linked to published market indicators. To spread risk, many contracts combine hog prices in the formula with the cutout value, an indicator of pork values (see Further detail). Some contracts also use the CME Lean Hog Index or futures in the formula.
Negotiated trade and price discovery
Prices from Negotiated purchases (0.9%) serve as references for formula pricing, including in Swine or Pork Market Formula contracts
Negotiated purchases are under 1% of hogs, but they are the only type in which buyer and seller negotiate each price, so they reflect day-to-day supply and demand most directly. The negotiated base price published by USDA is also the most common external reference price used in formula contracts.
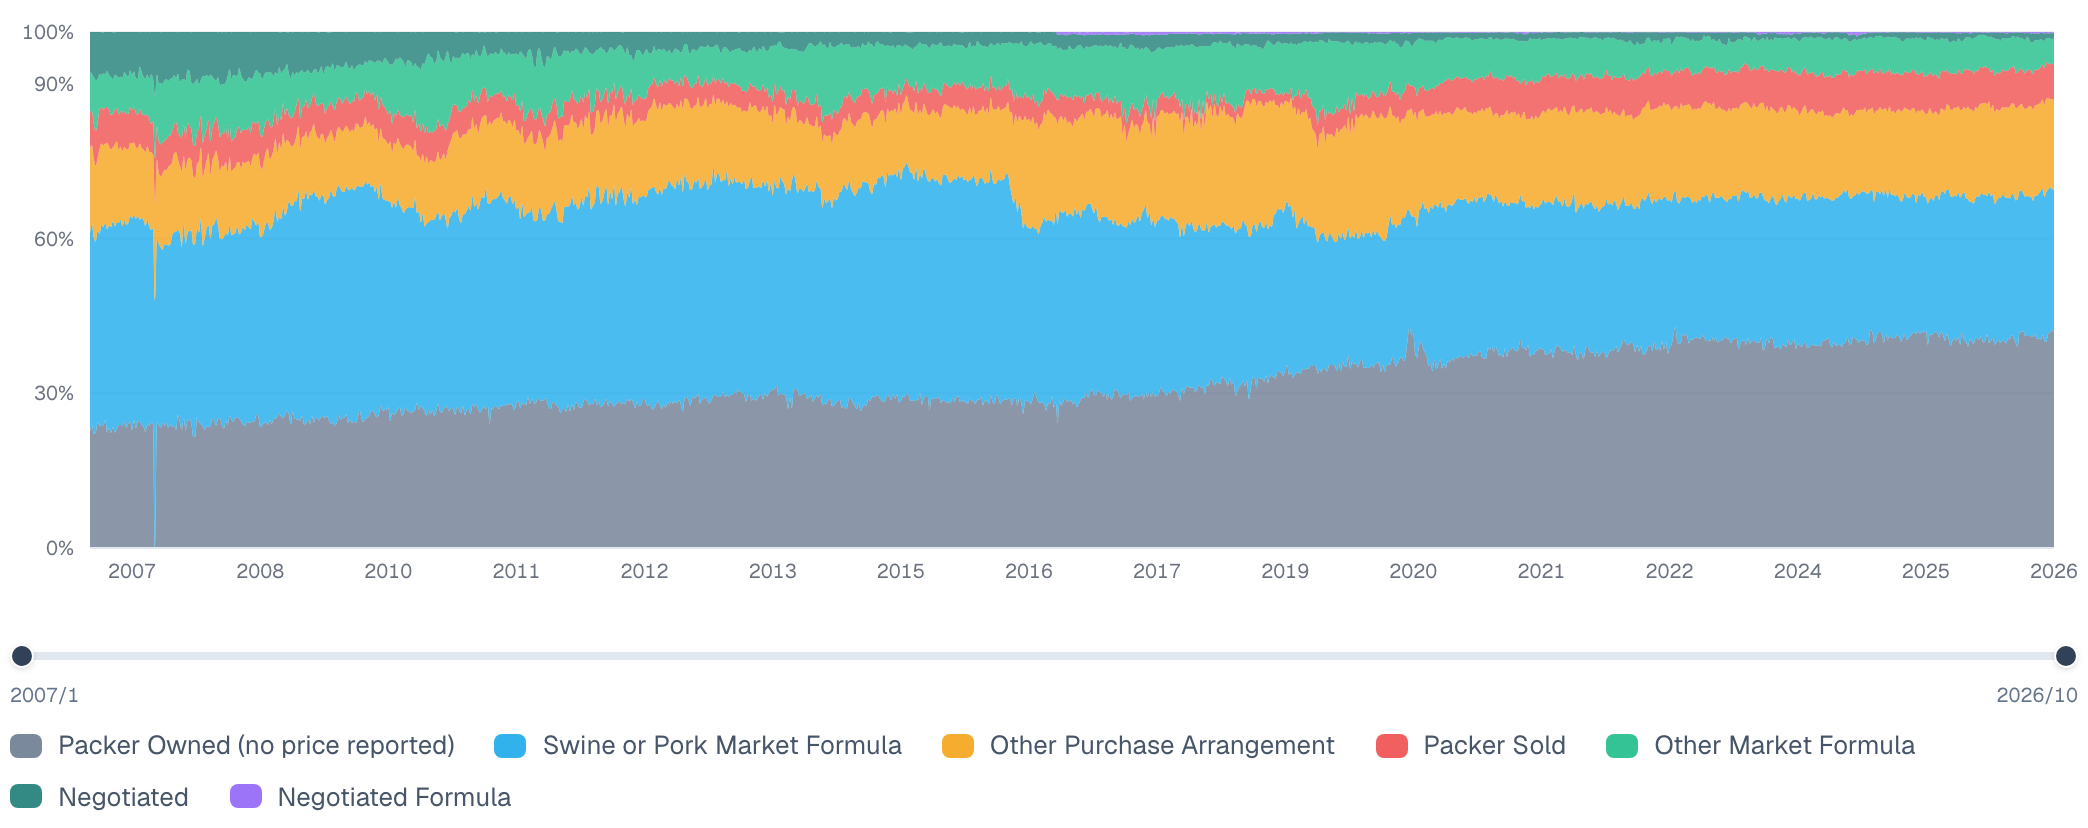
The CME Lean Hog Index is calculated from the net prices of Negotiated, Negotiated Formula and Swine or Pork Market Formula purchases. Because purchases priced off the index are classified as Swine or Pork Market Formula, their prices in turn become inputs to the index (see figure). New movement in the index comes from purchases priced off the negotiated price or the cutout.
Scroll sideways to see the whole chart
Purchase type shares since 2007
Relationship to CME Lean Hog futures
The CME Lean Hog Index, used to settle CME Lean Hog futures, is calculated from net prices in the prior-day slaughter report. CME uses the Producer Sold net prices for three purchase types (Negotiated, Negotiated Formula and Swine or Pork Market Formula) over the latest two business days, weighted by carcass weight.
Futures prices reflect market participants' expectations and hedging against price risk. USDA cash prices are the prices actually paid in the current market, and they come with breakdowns by purchase type, region and quality.
Differences in how futures and cash prices move affect how well a hedge works, so producers and packers that hedge need to follow both markets.
At expiration, futures settle against the CME Lean Hog Index, which is calculated from the net prices in this report. In other words, live hog price movements start from the negotiated price.
Common misconceptions
- ✕“The carcass base price is a price for carcasses”
It is not the price of carcasses in the meat trade. It is what packers pay producers for live hogs, priced per unit of carcass weight. The wholesale indicator on the pork side is the cutout value.
- ✕“USDA hog prices are auction prices”
They are not set at an auction. The reports cover direct trades between producers and packers (the “Direct” in the report names), compiled from the reports packers are legally required to file on their negotiated and contract purchases nationwide.
- ✕“The published average covers all U.S. hogs”
Packer-owned hogs, about 40% of slaughter, have no transaction price and fall outside the price averages. Published prices reflect the 60% of hogs that are bought and sold. This does not contradict the 97% coverage figure: 97% describes how much of slaughter is subject to reporting, and packer-owned hogs are reported too, but only as head counts and carcass data.
Key points
- USDA hog prices are compiled from actual transactions under mandatory reporting (LMR). Reporting plants cover about 97% of U.S. hog slaughter, and each day's trades are published the next day.
- Read each price along five dimensions: purchase or slaughter date, who sold the hogs, purchase type, base or net price, and live or carcass basis. Most hogs are priced on carcass weight under formulas.
- Negotiated purchases are under 1% of hogs but anchor price discovery as the reference for formulas. Packer-owned hogs (about 40%) have no price.
- The industry watches CME Lean Hog futures most closely, but USDA cash prices are an important indicator too, because futures settle at expiration based on them.
Further detail: from base price to net price
| Lean percent | Calculated from backfat thickness and loin depth |
| Weight range | Discount for carcasses outside the set weight range (sort loss) |
| Non-carcass factors | Such as delivery time |
| Contract premiums | Such as a fixed amount set in the contract |
The standards and amounts are agreed between each packer and producer and are generally not public. USDA publishes only averages and ranges.
- Head count
- 227,321
- Carcass weight
- 217.99 lb
- Backfat
- 0.65 in
- Loin depth
- 2.73 in
- Lean percent
- 56.15%
Premiums differ by purchase type mainly because of differences in hog quality (lean percent) and the contract premiums written into formula and other contracts. On this day, negotiated hogs had a lower lean percent than the others and received smaller premiums.
For hogs slaughtered on October 8, 2026, the weighted average for Producer Sold was a base price of $77.13/cwt and a net price of $78.53/cwt. The net price is not always higher: the same day, negotiated hogs had a base price of $77.44 and a net price of $76.59.
Further detail: price behavior by purchase type
Prices can move quite differently by purchase type. Comparing monthly average net prices, negotiated prices swing the most and Other Purchase Arrangement prices the least.
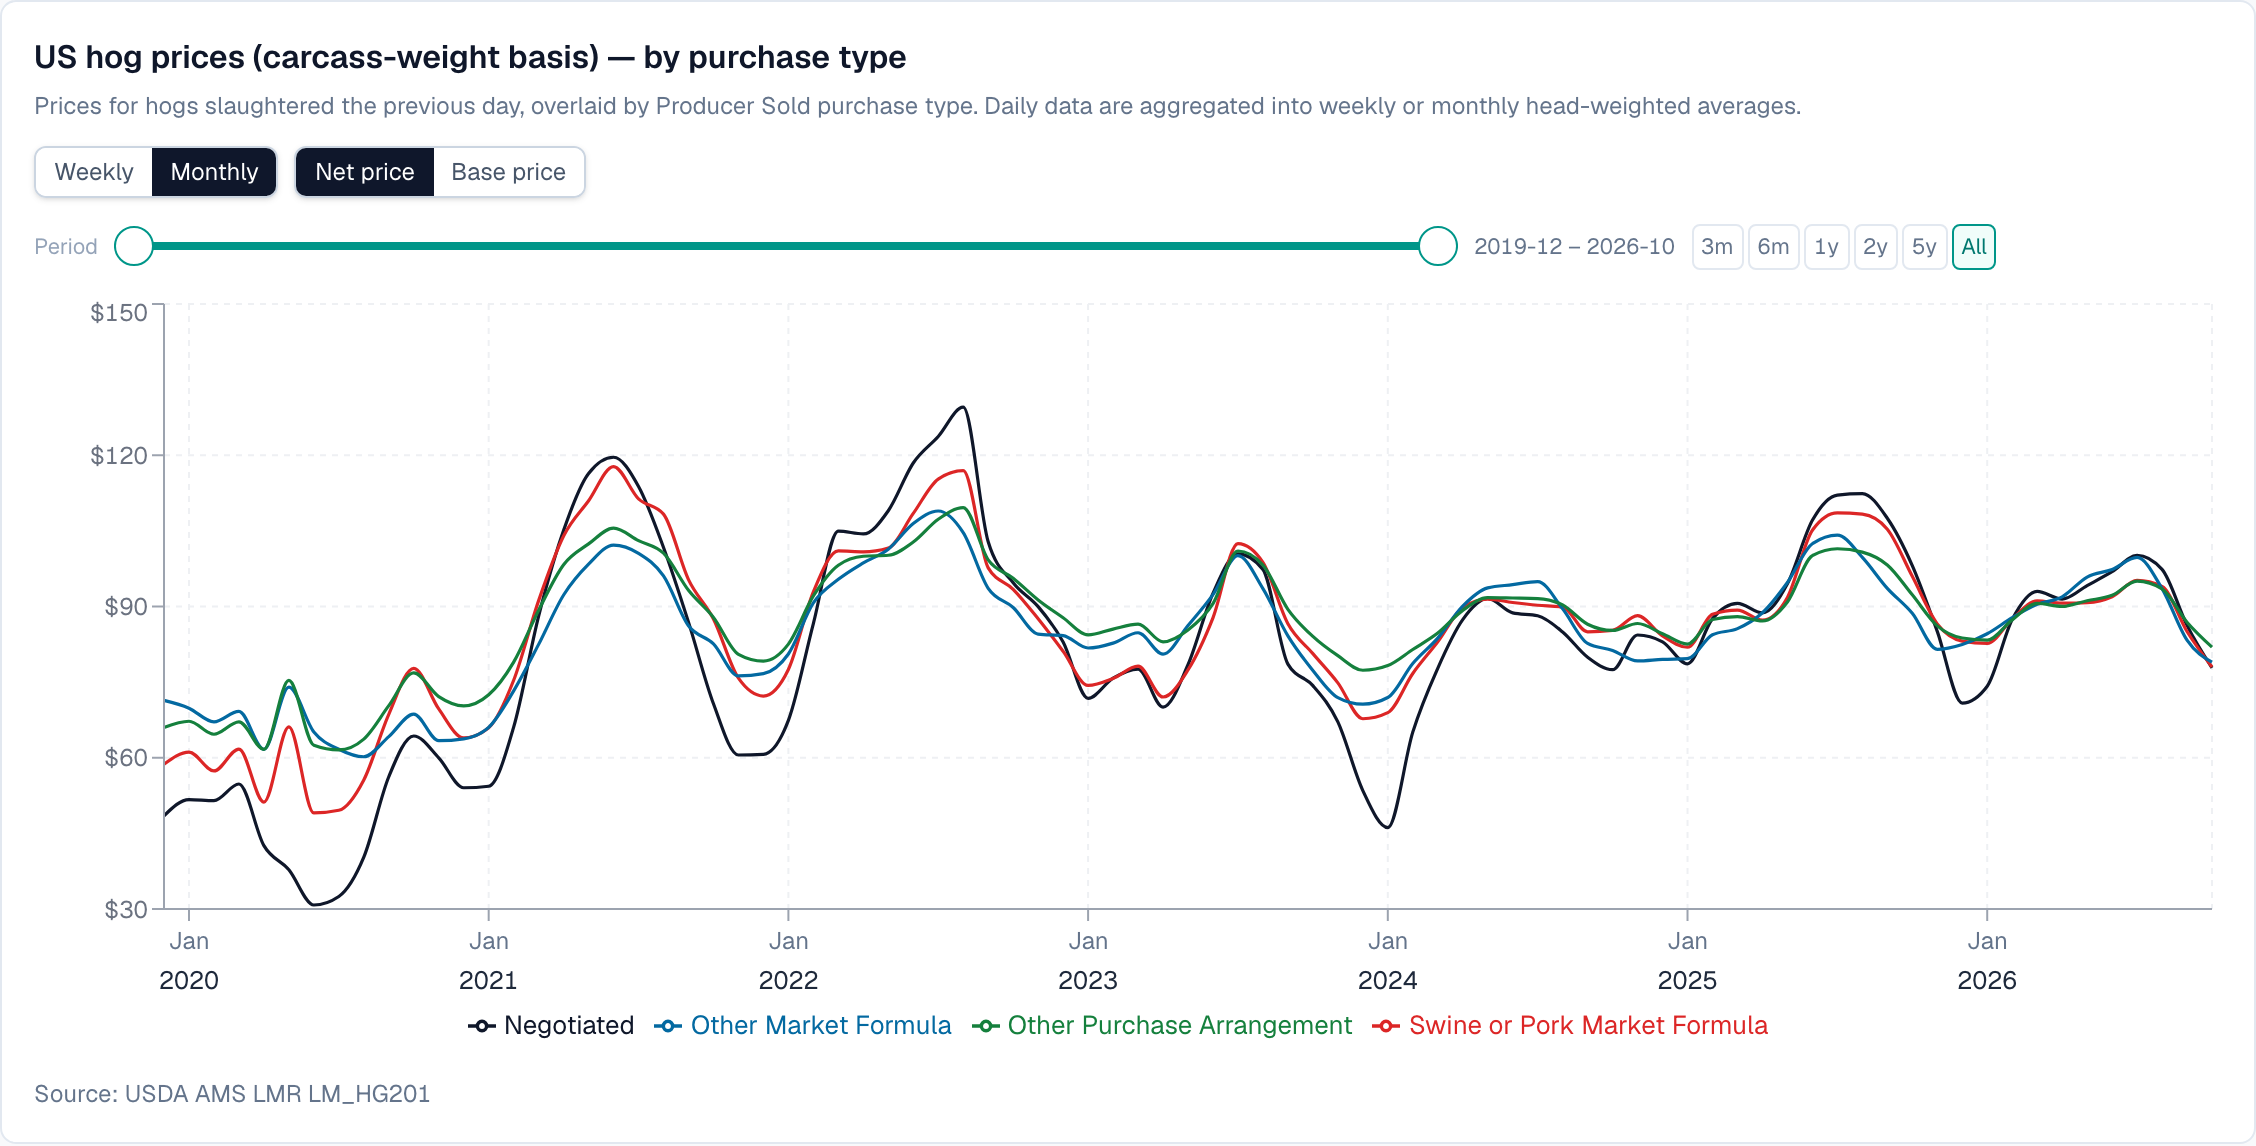
Negotiated hogs are bought on the spot, separately from hogs secured under long-term contracts, to fill spare slaughter capacity. When there is no spare capacity, they are not bought. As a result, their prices swing the most: in May and June 2020, when plants were shut down, negotiated prices were more than $30 below Other Purchase Arrangement prices.
How formula design changes price swings
Some contracts do not use the negotiated price as is, but build other elements into the formula. There are four main approaches.
| Blend in the cutoutSwine or Pork Market Formula | Combine the negotiated price and the cutout in set proportions (for example, half the negotiated price plus half of 90% of the cutout). The cutout tracks what packers can sell pork for, so including it limits the packer's risk when hog prices are high and the cutout is low. In return, the packer gives up part of the larger margin available when hog prices are low and the cutout is high. |
| Price off the CME index or futuresSwine or Pork Market Formula / Other Market Formula | Set the price from the CME Lean Hog Index or the nearby futures price (for example, nearby futures minus $2.50). Some formulas also combine these with the negotiated price or the cutout. |
| Set a floor and ceilingOther Purchase Arrangement | If the price moves above the ceiling or below the floor, the ceiling or floor is paid. Many contracts instead split the amount outside the range equally between packer and producer. |
| Base it on feed pricesOther Purchase Arrangement | Set the hog price from corn and soybean meal prices. |
USDA rules place contracts priced with a floor and ceiling or from feed prices in Other Purchase Arrangement. Contracts priced off the index have been classified as Swine or Pork Market Formula since 2017; those priced off futures fall under Other Market Formula.
The figure below applies the cutout blend and the floor-and-ceiling formula to actual monthly average negotiated prices.
The data in this article is available on this dashboard.
- USDA AMS — A User's Guide to USDA's LMR Hog Price Reports (2018)
- USDA AMS — Livestock Mandatory Reporting (program page)
- USDA AMS — LMR Background (history of the program)
- USDA AMS — FY2026 Explanatory Notes (coverage: 97% of slaughtered hogs, 87% of wholesale pork)
- eCFR — 7 CFR Part 59 (LMR regulations; legal definitions of purchase types and prices)
- CRS R45777 — Livestock Mandatory Reporting Act (2019)
- USDA AMS — National Daily Direct Hog Prior Day Report – Slaughtered Swine (LM_HG201)
- USDA AMS — Daily Direct Prior Day Hog Report (LM_HG218)
- USDA AMS — Weekly National Direct Swine Report (LM_HG214; source of year-to-date shares)
- USDA AMS Datamart (data for all reports)
- Parcell & Schulz — A Review of the USDA Swine Contract Library (study for USDA AMS, 2024; negotiated prices as the base for formula contracts, packer-owned share over time)
- Value Ag — Baseline Study of Livestock and Meat Marketing Trends and Implications for LMR (study for USDA AMS, 2016; decline of negotiated trade and its role in price discovery)
- USDA AMS — Swine Packer Marketing Contract Summary, National, Swine or Pork Market Formula (Swine Contract Library, March 2025; what formulas are priced off)
- CME Group — Overview of CME Lean Hog Index and Lean Hog Futures (hosted by USDA AMS, 2021; Lean Hog Index methodology)
- Butcher & Schulz — Hog Price and Volume Comparisons across Alternative Sale Types, Emphasis on COVID-19 Disruptions (Iowa State University CARD 21-PB 36, 2021; classification of index-based sales and the feedback loop)
- Kansas State University — Valuing Market Hogs: Information and Pricing Issues (MF2644)
- Pork Information Gateway — Marketing Slaughter Hogs: Where, When & How (PIG 11-03-03)
Shares are 2026 year-to-date USDA figures through the week ending July 4, 2026 (weekly report LM_HG214). Price examples are for hogs slaughtered on October 8 and October 12, 2026.
Drafted with AI under the direction of our editor, who reviewed and edited every section.